View this page as a printable (PDF) here.
“The reality is that wind power is intermittent because the wind does not blow constantly. Therefore, wind turbine power generation constantly varies and cannot be depended on to provide a consistent, reliable flow of electricity on demand.”
Quick Bullets
- In 2021, wind energy accounted for 9.2 percent of net electricity generation[1] in the United States.
- Texas generates the most electricity from wind power[2] , and Iowa had the highest share of in-state electricity supplied by wind (58 percent)[3] in 2020.
- The installed capacity, or nameplate capacity, of wind facilities does not reflect the actual amount of electric power produced.
Introduction
Wind energy is electric power generated by wind-driven turbines. The wind turns the turbine blades[4], which turn a drive shaft that connects to a gearbox that converts the rotor power, turning an electric generator, which produces electricity that is sent to the grid. In direct-drive turbines, the gearbox is left out and the rotors directly stimulate the generator. In both cases, electricity is generated when the blades spin.
Wind turbines can be placed on land, offshore in the form similar to onshore towers, or on floating structures[5] for deeper water applications.
Wind energy currently accounts for approximately 9 percent of net electricity generation in the United States. According to 2020 data, wind accounts for[6] 5.3 percent of worldwide electricity generation, and 2.2 percent of total global energy, which includes transportation and heating. The top three countries with the largest amount[7] of wind energy are China with 328.97 gigawatts (GW) installed wind energy capacity, the United States with 132.74 GW, and Germany with 63.76 GW.
Growth
From 2000 to 2016, the installed global capacity[8] of wind energy rose 2,592 percent, increasing from a cumulative global capacity of about 17,329 megawatts (MW) to nearly 466,505 MW.
In the United States, installed wind capacity increased 5,477 percent[9] from 2000 to 2021, though the greatest number of new turbines were installed in 2020.
The rapid growth of wind power has primarily been driven by substantial subsidies given to the industry and laws mandating the use of electricity generated by wind. In the United States, federal government support for wind comes in the form of a Renewable Electricity Production Tax Credit[10], which was recently restored, although slightly altered, by the Inflation Reduction Act[11]. This tax credit grants a per-kilowatt hour credit for any electricity generated by approved renewable sources, such as wind power. Electricity from wind gets up to 2.5 cents per kilowatt hour[12].
Additionally, many states have individual renewable portfolio standards (RPS)[13] that mandate increasing amounts of electricity delivered within the state from sources like wind power, regardless of the cost. Some states and localities also offer tax abatements or property tax reductions for new wind facilities.
Similar to U.S. mandates, the United Kingdom also requires electricity suppliers to use an increasing amount of renewables-generated electricity via its Renewables Obligation program[14].
Because additions of large wind industrial facilities to the energy system of the United States are so dependent on the Renewable Electricity Production Tax Credit and similar policies, the Energy Information Administration projects[15] that wind will make up a very small percentage of the new additions to the U.S electricity generation capacity in the future.
Cost
Levelized average costs[16] of electricity that is generated from wind turbines are comparable with other new generation technologies like solar and geothermal. Exceptions to this are offshore wind and battery storage, which produce energy at a much higher cost than other new generation technologies.
Offshore wind has the lowest[17] value-to-cost ratio of all new generation resources.
However, sources that claim to predict costs of electricity from these resources should be taken with a grain of salt. Organizations promoting renewables do not always take actual capacity factors[18] into account, instead relying on the idealized 40 percent range for wind. In reality, the capacity factor for onshore wind especially will be lower. Additionally, levelized costs may not include all the repair, replacement, and removal costs of turbines.
Because wind turbines tend to be located in remote areas far from where the power is needed, new transmission lines, transformers, and other infrastructure must be built, adding to the cost[19]. Transporting parts to these distant places to build the turbines also has a significant price tag, making up about 10 percent of the upfront capital cost.
Nameplate Capacity Versus Actual Power Generation
When “installed capacity” is discussed, what is being referenced is what is usually called “nameplate capacity.” This is the amount of power that can be produced by the turbine generators under ideal conditions. For wind, this usually entails sustained winds over a certain speed. The optimal wind speed is different depending on the size and type[20] of turbine. Larger rotor blades can make use of lower wind speeds.
Installed capacity[21] is usually calculated by taking the nameplate capacity of each turbine at an industrial wind facility and adding them together.
The reality is that wind power is intermittent because the wind does not blow constantly. Therefore, wind turbine power generation varies and cannot be depended on to provide a consistent, reliable flow of electricity on demand. Consequently, grids connected to wind turbines require a dispatchable backup energy source[22] to keep the grid load balanced. This requires keeping redundant power sources on standby or operating as spinning reserve in order to provide power quickly when the wind currents are insufficient or too powerful to generate power from turbines. In addition, other generating sources must operate at inefficient levels to ramp up or down quickly to regulate the variable amount of power wind turbines supply to the system as wind currents wax and wane.
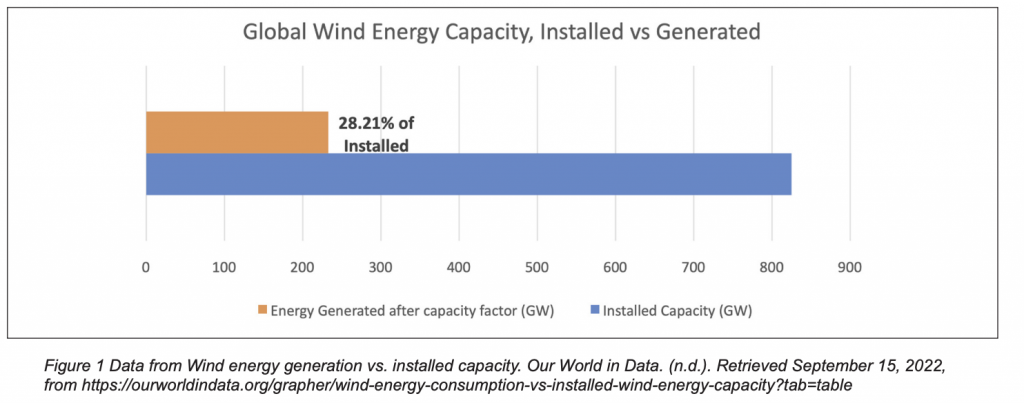
Doing simple math using numbers from Our World in Data[23] on installed global wind energy capacity (at 824.87 GW) and wind power generation (1,861,940 GWh), we can estimate an average capacity factor of about 28.21 percent worldwide for wind power.
Endnotes
[1] Wind explained. U.S. Energy Information Administration (EIA). (n.d.). Retrieved September 15, 2022, from
https://www.eia.gov/energyexplained/wind/electricity-generation-from-wind.php
[2] The United States installed more wind turbine capacity in 2020 than in any other year. Homepage – U.S. Energy Information Administration (EIA). (n.d.). Retrieved September 15, 2022, from
https://www.eia.gov/todayinenergy/detail.php?id=46976
[3] Ibid.
[4] Wind Power Facts and Statistics. CleanPower.org. Retrieved September 15, 2022, from
https://cleanpower.org/facts/wind-power/
[5] NREL floats new offshore wind cost optimization vision. NREL.gov. (n.d.). Retrieved September 15, 2022, from
https://www.nrel.gov/news/program/2020/nrel-floats-new-offshore-wind-cost-optimization-tool.html
[6] Hannah Ritchie, Max Roser and Pablo Rosado (2020) – “Energy”. Published online at OurWorldInData.org. Retrieved from: ‘
https://ourworldindata.org/energy’ [Online Resource]
[7] BP Statistical Review of World Energy. (n.d.). Installed Wind Energy Capacity. Our World in Data. Retrieved September 15, 2022, from
https://ourworldindata.org/grapher/cumulative-installed-wind-energy-capacity-gigawatts?country=ESP~IND~AUS~DEU~JPN~ITA~USA~GBR~CHN~NLD
[8] Ritchie, H., Roser, M., & Rosado, P. (2020, November 28). Renewable energy. Our World in Data. Retrieved September 15, 2022, from
https://ourworldindata.org/renewable-energy
[9] Ibid.
[10] Renewable energy tax credits. Energy Star. (n.d.). Retrieved September 15, 2022, from
https://www.energystar.gov/about/federal_tax_credits/renewable_energy_tax_credits
[11] Wojick, D. (2022, August 31). Renewables subsidy chaos coming. The Heartland Institute. Retrieved September 15, 2022, from
https://www.heartland.org/news-opinion/news/renewables-subsidy-chaos-coming
[12] EPA. (2022, July 8). Renewable Electricity Production Tax Credit Information. United States Environmental Protection Agency.
[13] EIA. (n.d.). Renewable energy explained – Portfolio standards. U.S. Energy Information Administration. Retrieved September 15, 2022, from
https://www.eia.gov/energyexplained/renewable-sources/portfolio-standards.php
[14] United Kingdom Ofgem. (n.d.). Renewables obligation (RO). Ofgem. Retrieved September 15, 2022, from
https://www.ofgem.gov.uk/environmental-and-social-schemes/renewables-obligation-ro
[15] U.S. Department of Energy. (n.d.). Annual Energy Outlook 2021. U.S. Energy Information Administration (EIA). Retrieved September 15, 2022, from
https://www.eia.gov/outlooks/archive/aeo21/pdf/AEO_Narrative_2021.pdf
[16] U.S. Department of Energy. (2022, March). Levelized costs of New Generation Resources in the annual energy … U.S. Energy Information Administration. Retrieved September 15, 2022, from
https://www.eia.gov/outlooks/aeo/pdf/electricity_generation.pdf
[17] Ibid.
[18] Eschenbach, W. (2021, June 25). The real cost of wind and Solar. Watts Up With That? Retrieved September 15, 2022, from
https://wattsupwiththat.com/2021/06/25/the-real-cost-of-wind-and-solar/
[19] Flanakin, D. (n.d.). The dangerous winds of trying to prevent climate change. The Heartland Institute. Retrieved September 15, 2022, from
https://www.heartland.org/news-opinion/news/the-dangerous-winds-of-trying-to-prevent-climate-change
[20] How windy does it have to be? Renewables First – The Hydro and Wind Company. (2015, July 3). Retrieved September 15, 2022, from
https://www.renewablesfirst.co.uk/windpower/windpower-learning-centre/how-windy-does-it-have-to-be/
[21] Barber, S. (2019, March 13). Annual energy production part 1 – making sense of nameplate capacity, capacity factor, load factor and more. Windspire. Retrieved September 15, 2022, from
https://www.windspire.ch/blog/2017/6/22/aep-part-1-capacity-and-more
[22] Zycher, B. (2019, April). The Green New Deal . AEI.org. Retrieved September 15, 2022, from
https://www.aei.org/wp-content/uploads/2019/04/RPT-The-Green-New-Deal-5.5×8.5-FINAL.pdf
[23] Wind energy generation vs. installed capacity. Our World in Data. (n.d.). Retrieved September 15, 2022, from
https://ourworldindata.org/grapher/wind-energy-consumption-vs-installed-wind-energy-capacity?tab=table
View this page as a printable (PDF) here.
“The reality is that wind power is intermittent because the wind does not blow constantly. Therefore, wind turbine power generation constantly varies and cannot be depended on to provide a consistent, reliable flow of electricity on demand.”
Quick Bullets
- In 2021, wind energy accounted for 9.2 percent of net electricity generation[1] in the United States.
- Texas generates the most electricity from wind power[2] , and Iowa had the highest share of in-state electricity supplied by wind (58 percent)[3] in 2020.
- The installed capacity, or nameplate capacity, of wind facilities does not reflect the actual amount of electric power produced.
Introduction
Wind energy is electric power generated by wind-driven turbines. The wind turns the turbine blades[4], which turn a drive shaft that connects to a gearbox that converts the rotor power, turning an electric generator, which produces electricity that is sent to the grid. In direct-drive turbines, the gearbox is left out and the rotors directly stimulate the generator. In both cases, electricity is generated when the blades spin.
Wind turbines can be placed on land, offshore in the form similar to onshore towers, or on floating structures[5] for deeper water applications.
Wind energy currently accounts for approximately 9 percent of net electricity generation in the United States. According to 2020 data, wind accounts for[6] 5.3 percent of worldwide electricity generation, and 2.2 percent of total global energy, which includes transportation and heating. The top three countries with the largest amount[7] of wind energy are China with 328.97 gigawatts (GW) installed wind energy capacity, the United States with 132.74 GW, and Germany with 63.76 GW.
Growth
From 2000 to 2016, the installed global capacity[8] of wind energy rose 2,592 percent, increasing from a cumulative global capacity of about 17,329 megawatts (MW) to nearly 466,505 MW.
In the United States, installed wind capacity increased 5,477 percent[9] from 2000 to 2021, though the greatest number of new turbines were installed in 2020.
The rapid growth of wind power has primarily been driven by substantial subsidies given to the industry and laws mandating the use of electricity generated by wind. In the United States, federal government support for wind comes in the form of a Renewable Electricity Production Tax Credit[10], which was recently restored, although slightly altered, by the Inflation Reduction Act[11]. This tax credit grants a per-kilowatt hour credit for any electricity generated by approved renewable sources, such as wind power. Electricity from wind gets up to 2.5 cents per kilowatt hour[12].
Additionally, many states have individual renewable portfolio standards (RPS)[13] that mandate increasing amounts of electricity delivered within the state from sources like wind power, regardless of the cost. Some states and localities also offer tax abatements or property tax reductions for new wind facilities.
Similar to U.S. mandates, the United Kingdom also requires electricity suppliers to use an increasing amount of renewables-generated electricity via its Renewables Obligation program[14].
Because additions of large wind industrial facilities to the energy system of the United States are so dependent on the Renewable Electricity Production Tax Credit and similar policies, the Energy Information Administration projects[15] that wind will make up a very small percentage of the new additions to the U.S electricity generation capacity in the future.
Cost
Levelized average costs[16] of electricity that is generated from wind turbines are comparable with other new generation technologies like solar and geothermal. Exceptions to this are offshore wind and battery storage, which produce energy at a much higher cost than other new generation technologies.
Offshore wind has the lowest[17] value-to-cost ratio of all new generation resources.
However, sources that claim to predict costs of electricity from these resources should be taken with a grain of salt. Organizations promoting renewables do not always take actual capacity factors[18] into account, instead relying on the idealized 40 percent range for wind. In reality, the capacity factor for onshore wind especially will be lower. Additionally, levelized costs may not include all the repair, replacement, and removal costs of turbines.
Because wind turbines tend to be located in remote areas far from where the power is needed, new transmission lines, transformers, and other infrastructure must be built, adding to the cost[19]. Transporting parts to these distant places to build the turbines also has a significant price tag, making up about 10 percent of the upfront capital cost.
Nameplate Capacity Versus Actual Power Generation
When “installed capacity” is discussed, what is being referenced is what is usually called “nameplate capacity.” This is the amount of power that can be produced by the turbine generators under ideal conditions. For wind, this usually entails sustained winds over a certain speed. The optimal wind speed is different depending on the size and type[20] of turbine. Larger rotor blades can make use of lower wind speeds.
Installed capacity[21] is usually calculated by taking the nameplate capacity of each turbine at an industrial wind facility and adding them together.
The reality is that wind power is intermittent because the wind does not blow constantly. Therefore, wind turbine power generation varies and cannot be depended on to provide a consistent, reliable flow of electricity on demand. Consequently, grids connected to wind turbines require a dispatchable backup energy source[22] to keep the grid load balanced. This requires keeping redundant power sources on standby or operating as spinning reserve in order to provide power quickly when the wind currents are insufficient or too powerful to generate power from turbines. In addition, other generating sources must operate at inefficient levels to ramp up or down quickly to regulate the variable amount of power wind turbines supply to the system as wind currents wax and wane.
Doing simple math using numbers from Our World in Data[23] on installed global wind energy capacity (at 824.87 GW) and wind power generation (1,861,940 GWh), we can estimate an average capacity factor of about 28.21 percent worldwide for wind power.
Endnotes
[1] Wind explained. U.S. Energy Information Administration (EIA). (n.d.). Retrieved September 15, 2022, from
https://www.eia.gov/energyexplained/wind/electricity-generation-from-wind.php
[2] The United States installed more wind turbine capacity in 2020 than in any other year. Homepage – U.S. Energy Information Administration (EIA). (n.d.). Retrieved September 15, 2022, from
https://www.eia.gov/todayinenergy/detail.php?id=46976
[3] Ibid.
[4] Wind Power Facts and Statistics. CleanPower.org. Retrieved September 15, 2022, from
https://cleanpower.org/facts/wind-power/
[5] NREL floats new offshore wind cost optimization vision. NREL.gov. (n.d.). Retrieved September 15, 2022, from
https://www.nrel.gov/news/program/2020/nrel-floats-new-offshore-wind-cost-optimization-tool.html
[6] Hannah Ritchie, Max Roser and Pablo Rosado (2020) – “Energy”. Published online at OurWorldInData.org. Retrieved from: ‘
https://ourworldindata.org/energy’ [Online Resource]
[7] BP Statistical Review of World Energy. (n.d.). Installed Wind Energy Capacity. Our World in Data. Retrieved September 15, 2022, from
https://ourworldindata.org/grapher/cumulative-installed-wind-energy-capacity-gigawatts?country=ESP~IND~AUS~DEU~JPN~ITA~USA~GBR~CHN~NLD
[8] Ritchie, H., Roser, M., & Rosado, P. (2020, November 28). Renewable energy. Our World in Data. Retrieved September 15, 2022, from
https://ourworldindata.org/renewable-energy
[9] Ibid.
[10] Renewable energy tax credits. Energy Star. (n.d.). Retrieved September 15, 2022, from
https://www.energystar.gov/about/federal_tax_credits/renewable_energy_tax_credits
[11] Wojick, D. (2022, August 31). Renewables subsidy chaos coming. The Heartland Institute. Retrieved September 15, 2022, from
https://www.heartland.org/news-opinion/news/renewables-subsidy-chaos-coming
[12] EPA. (2022, July 8). Renewable Electricity Production Tax Credit Information. United States Environmental Protection Agency.
[13] EIA. (n.d.). Renewable energy explained – Portfolio standards. U.S. Energy Information Administration. Retrieved September 15, 2022, from
https://www.eia.gov/energyexplained/renewable-sources/portfolio-standards.php
[14] United Kingdom Ofgem. (n.d.). Renewables obligation (RO). Ofgem. Retrieved September 15, 2022, from
https://www.ofgem.gov.uk/environmental-and-social-schemes/renewables-obligation-ro
[15] U.S. Department of Energy. (n.d.). Annual Energy Outlook 2021. U.S. Energy Information Administration (EIA). Retrieved September 15, 2022, from
https://www.eia.gov/outlooks/archive/aeo21/pdf/AEO_Narrative_2021.pdf
[16] U.S. Department of Energy. (2022, March). Levelized costs of New Generation Resources in the annual energy … U.S. Energy Information Administration. Retrieved September 15, 2022, from
https://www.eia.gov/outlooks/aeo/pdf/electricity_generation.pdf
[17] Ibid.
[18] Eschenbach, W. (2021, June 25). The real cost of wind and Solar. Watts Up With That? Retrieved September 15, 2022, from
https://wattsupwiththat.com/2021/06/25/the-real-cost-of-wind-and-solar/
[19] Flanakin, D. (n.d.). The dangerous winds of trying to prevent climate change. The Heartland Institute. Retrieved September 15, 2022, from
https://www.heartland.org/news-opinion/news/the-dangerous-winds-of-trying-to-prevent-climate-change
[20] How windy does it have to be? Renewables First – The Hydro and Wind Company. (2015, July 3). Retrieved September 15, 2022, from
https://www.renewablesfirst.co.uk/windpower/windpower-learning-centre/how-windy-does-it-have-to-be/
[21] Barber, S. (2019, March 13). Annual energy production part 1 – making sense of nameplate capacity, capacity factor, load factor and more. Windspire. Retrieved September 15, 2022, from
https://www.windspire.ch/blog/2017/6/22/aep-part-1-capacity-and-more
[22] Zycher, B. (2019, April). The Green New Deal . AEI.org. Retrieved September 15, 2022, from
https://www.aei.org/wp-content/uploads/2019/04/RPT-The-Green-New-Deal-5.5×8.5-FINAL.pdf
[23] Wind energy generation vs. installed capacity. Our World in Data. (n.d.). Retrieved September 15, 2022, from
https://ourworldindata.org/grapher/wind-energy-consumption-vs-installed-wind-energy-capacity?tab=table